
Preface
You can monitor and administrate Just Store with a web browser. By default Just Store is configured for direct connections using the IP address 172.16.x.10. You need the exact IP address to connect to the web administration interface.
Following animation indicates that the user interface is waiting for data. It will disappear as soon as all data has been retrieved.

Accessing the System Monitor
- Open a web browser. We suggest using Firefox, Safari, Edge or Chrome. Internet Explorer can cause style and function issues.
- Enter the IP address or hostname of the Just Store system you want to connect to into the address bar of your web browser.
- Press the enter key.
- Select Monitor on the main page.

Enter your login credentials and press the Login button.
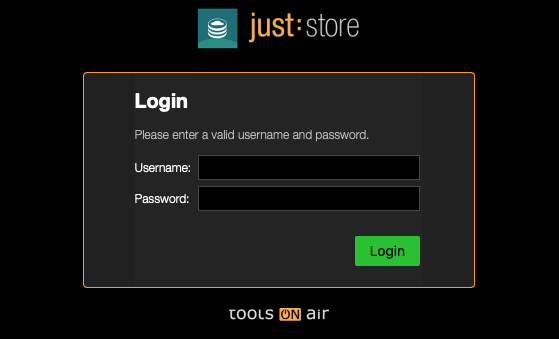
DEFAULT LOGIN
Username = Just Store
Password = Just Store
- To show or hide a section click on the respective arrow icons.

Overview
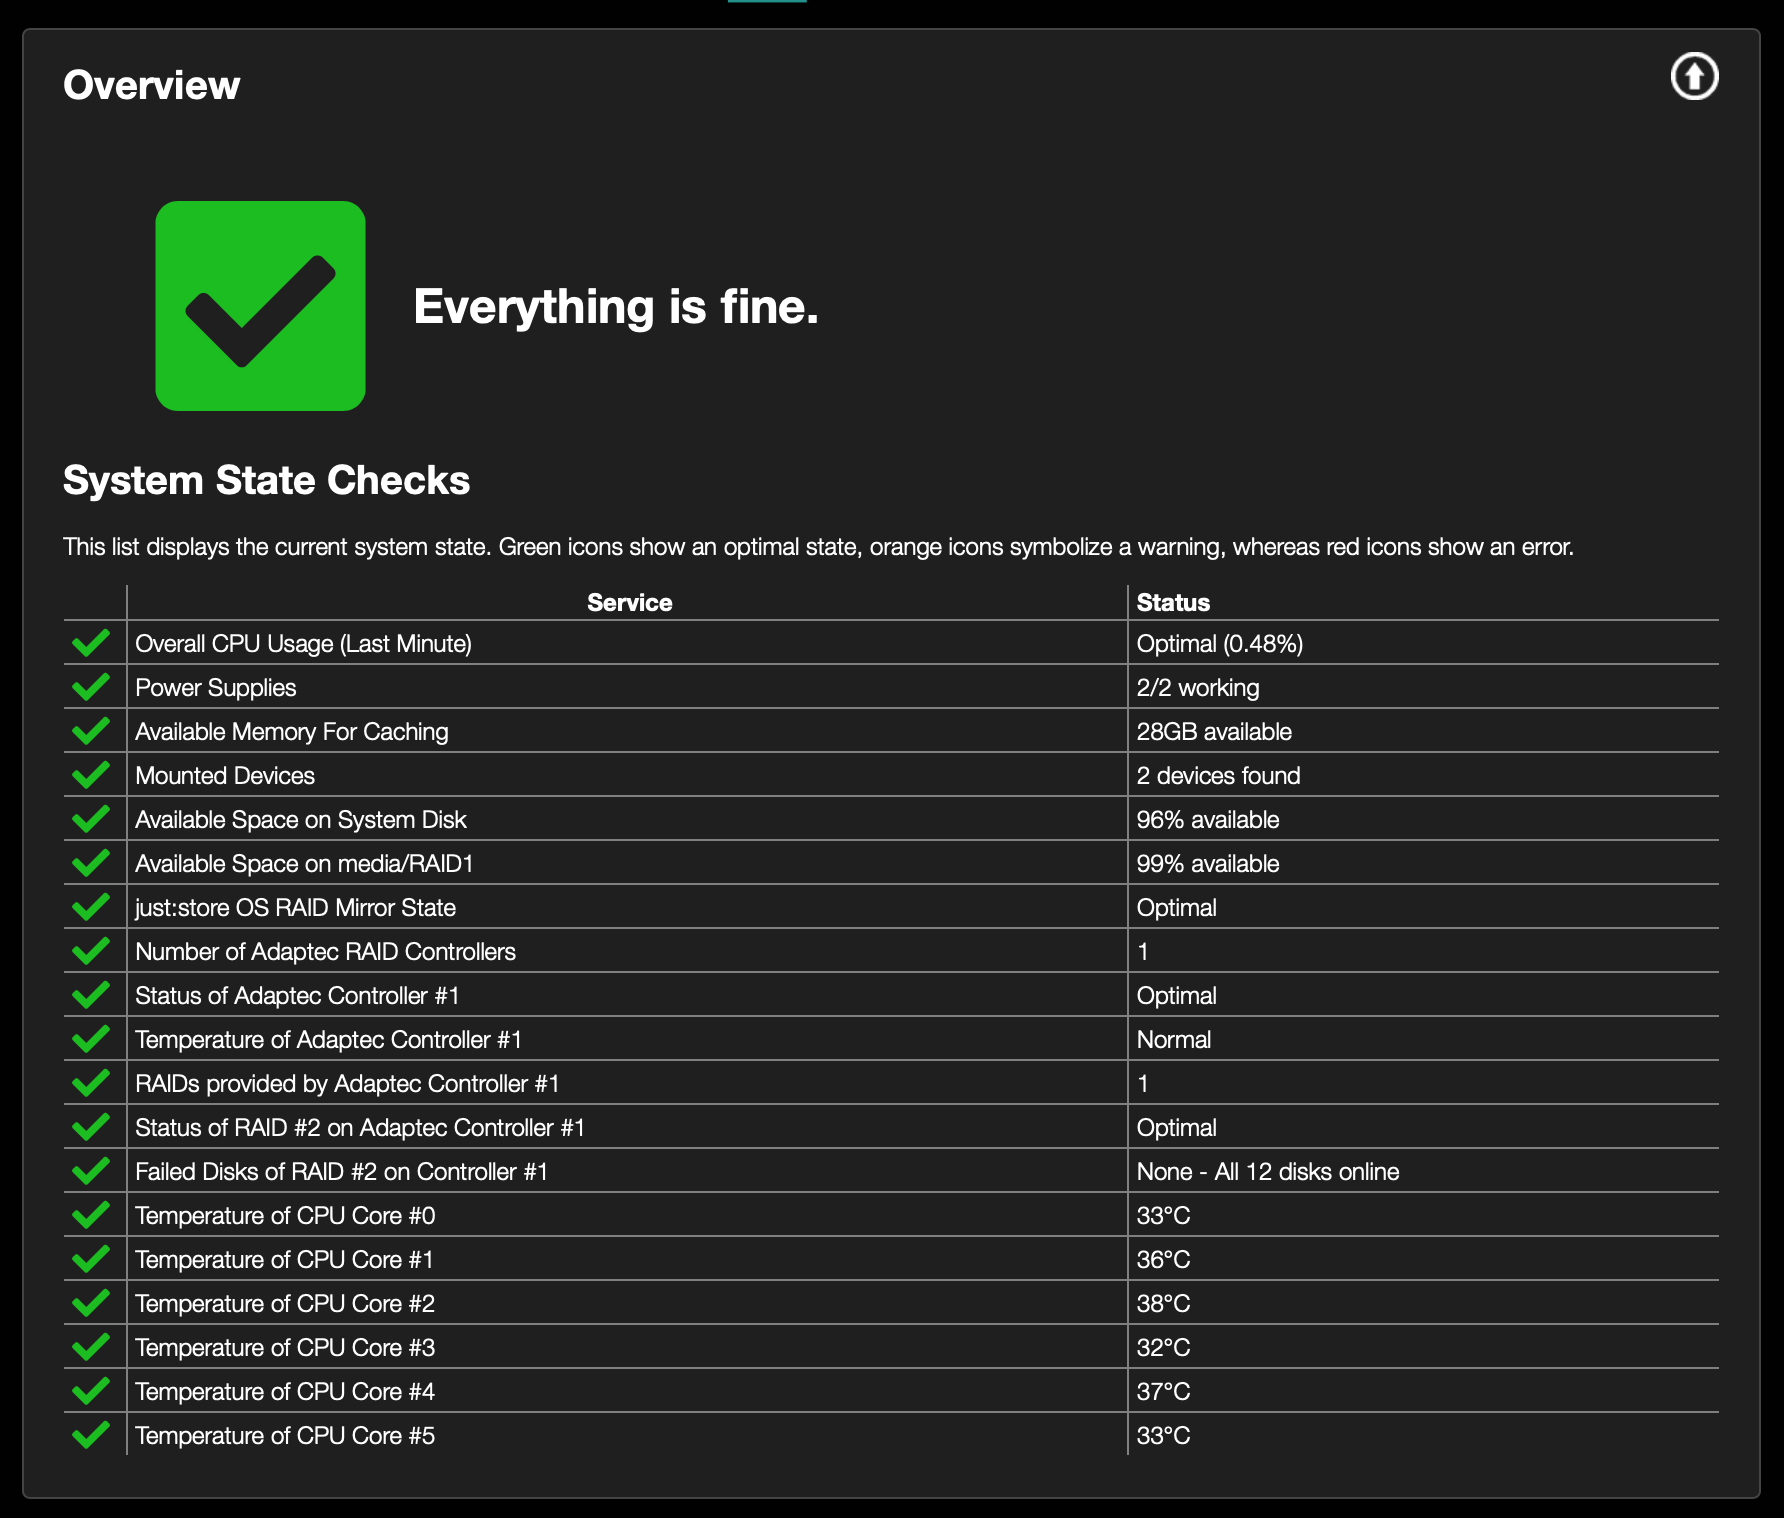
The Overview section displays crucial information about your Just Store system. It allows for a quick check of the overall health of the system.

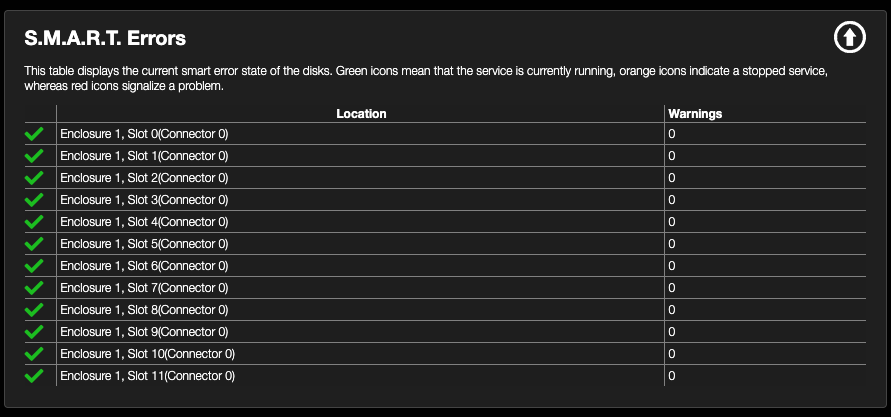
S.M.A.R.T. Error
S.M.A.R.T. Error lists all disks of the RAIDs provided by the integrated RAID Controller. Green marked ones have no S.M.A.R.T. Errrors.
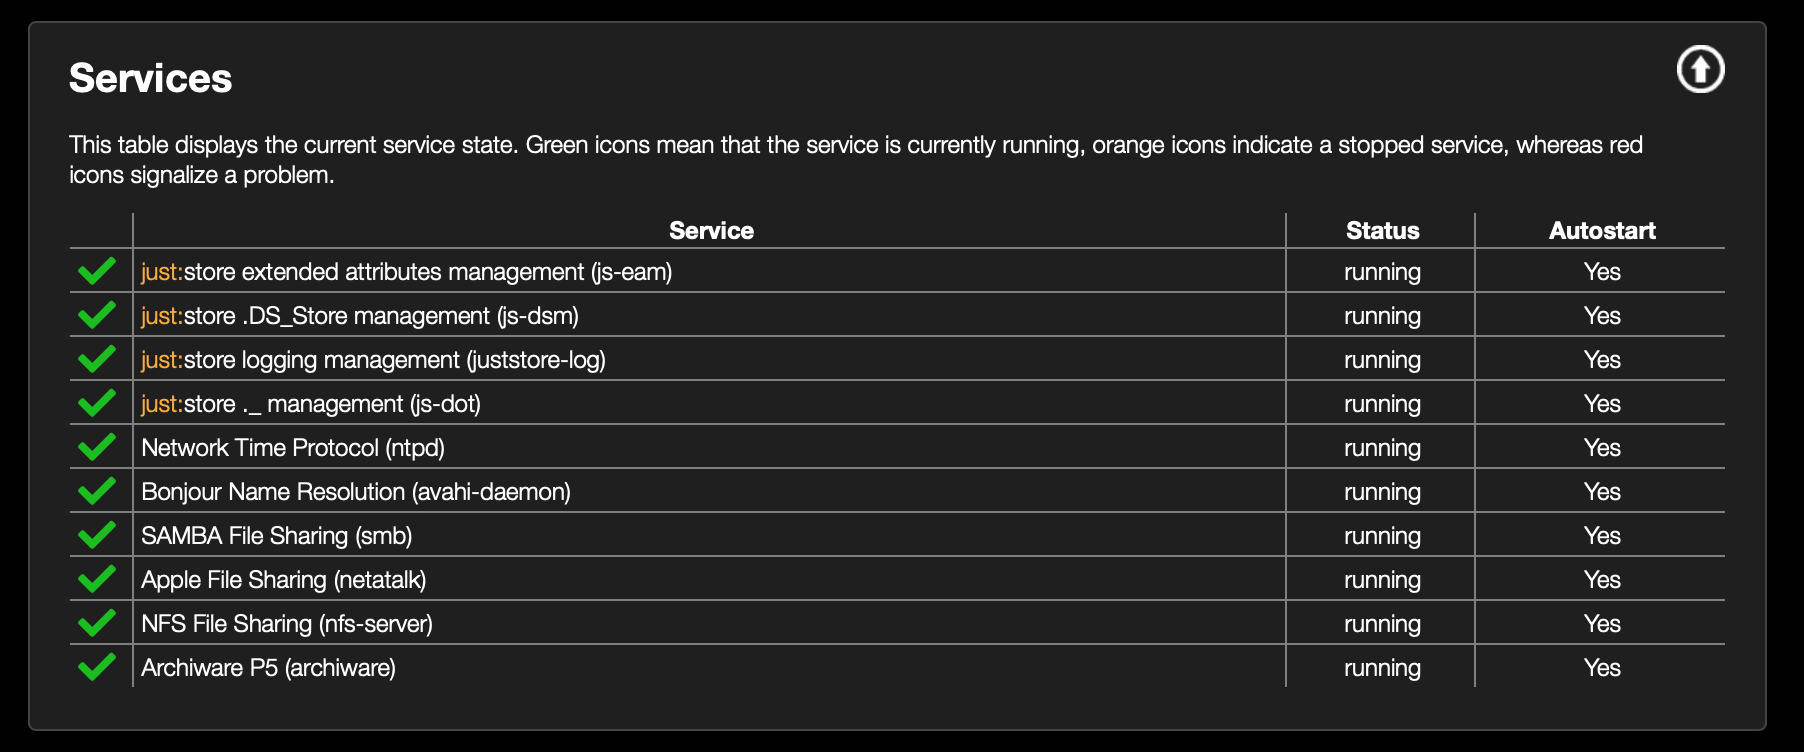
Services
Services lists all relevant services. Green marked ones are running fine.
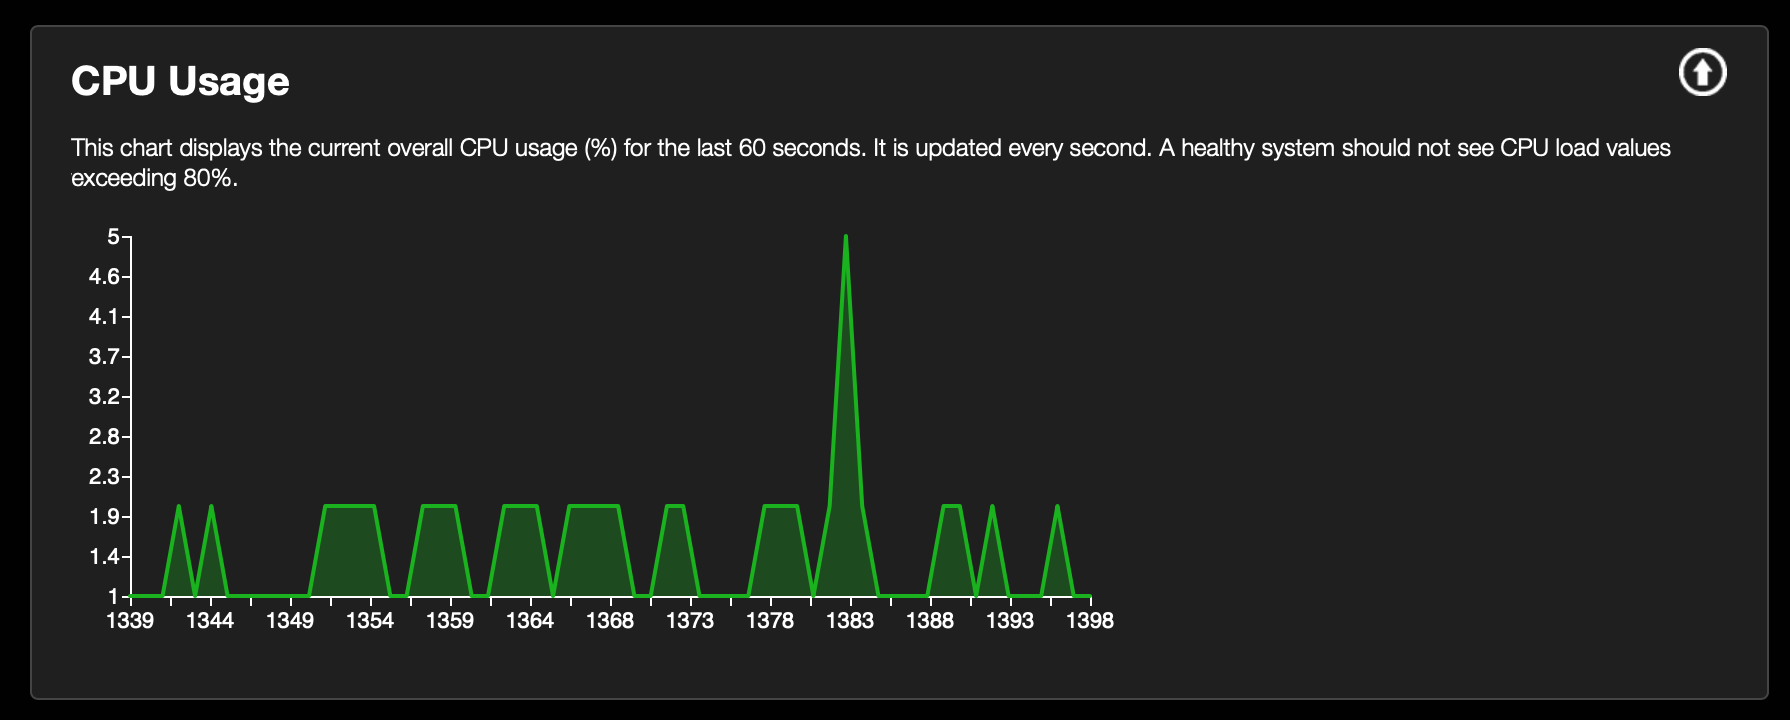
CPU Usage
The current CPU Usage is shown as a graph
Memory Usage
The current Memory Usage is shown as a pie chart.

Colors
Green = available space
Red = used space for caching
Blue = used space for programs
Disk Usage
The Disk Usage is shown as a pie chart.

Colors
Green = available space
Red = used space
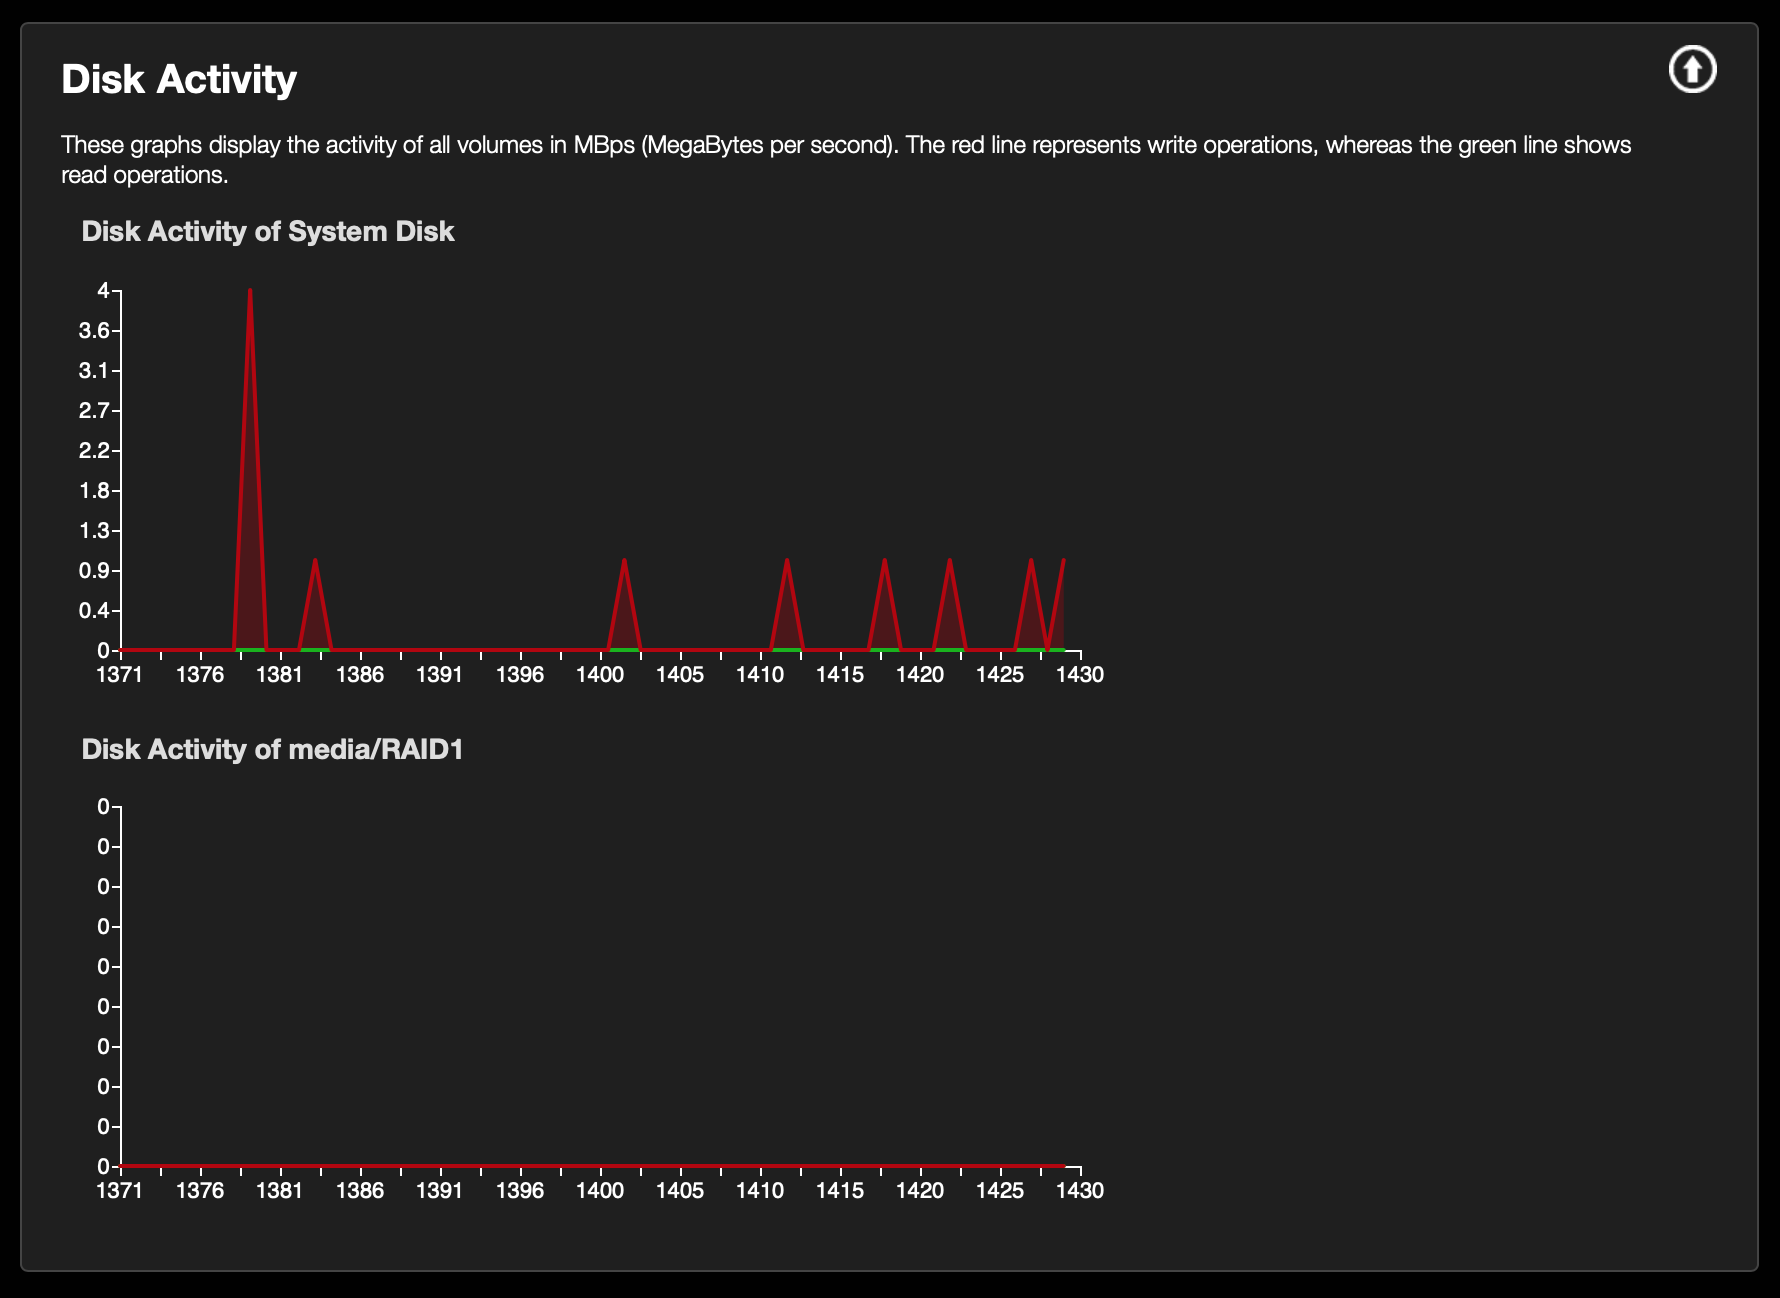
Disk Activity
The Disk Activity section displays a realtime graph which indicates the activity on the disks – either on the RAIDs or the system disks.
Colors
Green = read operation
Red = write operation
Network Activity
The Network Activity section displays realtime graphs for each network interface which indicates the activity on it. Every graph has a heading which shows the name of the network interface or the custom note of the interface
