
Table of Contents
Accessing the Dashboard
Read the article Connecting to the Just Store Web-based Administration User Interface to access the dashboard.
The Dashboard
The Just Store dashboard offers a quick overview about the most important parts of your Just Store system.

System Overview
The system overview at the top displays vital information about your Just Store hardware. Depending on your hardware configuration the displayed information may differ.

RAID Information
This area shows status information of the RAID controllers and their logical devices.
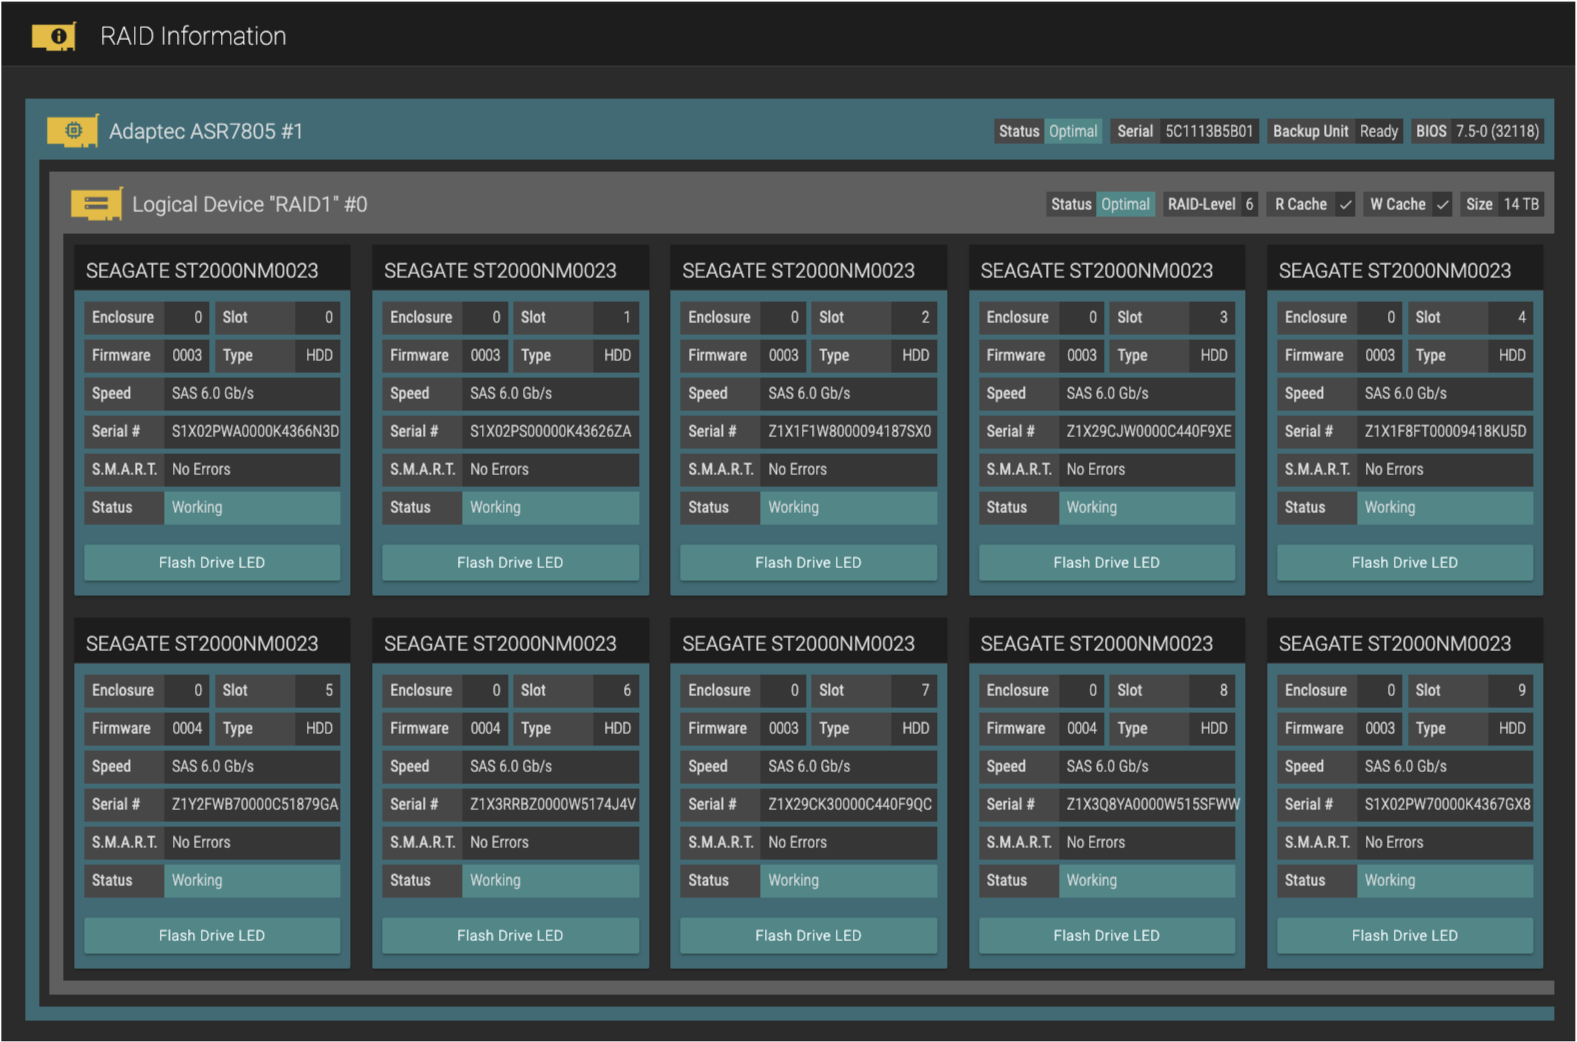
Controller & Logical Device Info
In the upper right area, additional info is shown for each controller and each logical device.

Controller Info
Status: state of the RAID controller.
Serial: serial number of the RAID controller
Backup Unit: state of the RAID’s backup unit.
BIOS: firmware version of the RAID controller.
Logical Device Info
Status: state of the logical device.
RAID-Level: RAID level of the logical device.
R Cache: shows if the cache for Reading operations is enabled.
W Cache: shows if the cache for Writing operations is enabled.
Size: size of the logical device.
Drive Overview
Inside of any logical device, there are several drives that are displayed as tiles. They contain information that may be helpful in case a drive fails or has issues.

Flashing a Drive’s LED to locate it physically
If a drive fails you want to replace it as fast as possible. To make that happen you can flash the drive’s LED to find it physically in your Just Store system.
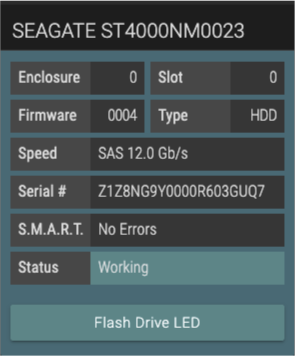
Press the Flash Drive LED of the respective drive and a dialog will show up, allowing you to define a time span where the drive’s LED will be blinking.

Hardware Information Overview
This area displays statistics of the CPU usage, used disk space, RAID activity, and other hardware related areas.

CPU Temperature
Shows the temperature of each CPU core. The x-axis lists each CPU core, while the y-axis shows the CPU core temperature.

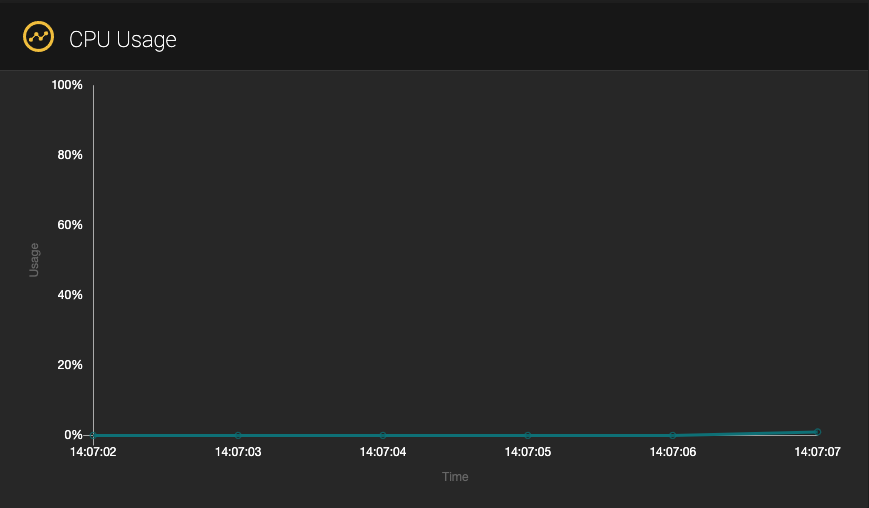
CPU Usage
Shows the CPU usage percentage. The x-axis is the time, while the y-axis is the CPU usage in percent.
OS Activity
Shows the read/write throughput of the operating system. The x-axis is the time, while the y-axis is the data throughput in MB/s.

RAID Activity
Shows the read/write throughput of the corresponding RAID. The x-axis is the time, while the y-axis is the data throughput in MB/s.

Network Interface Activity
Shows the read/write throughput of the corresponding network interface. The x-axis is the time, while the y-axis is the data throughput in MB/s.
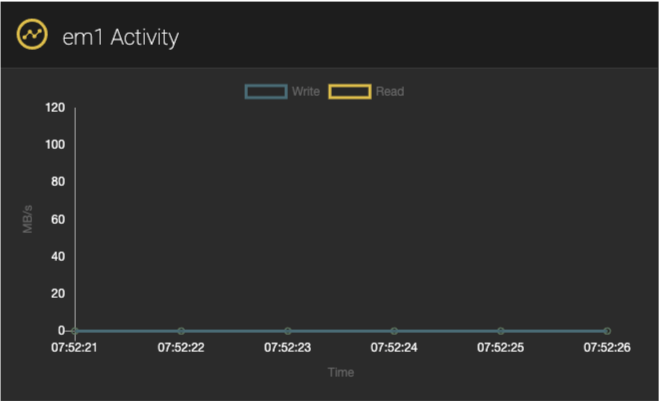
Definition of Read & Write
Read: packages that a client receives from Just Store.
Write: packages that Just Store receives from a client.