
The app bar runs along the top of each page, and the sidebar appears on the left. Use them to open dashboards and configuration pages, check host health and flow errors, and access the user menu.
Sidebar
The sidebar has two widths. Click the menu button at the left end of the app bar to switch between the full sidebar with labels and the narrow icon strip. The sidebar collapses automatically when the browser window is narrower than 700 pixels. In the narrow view, click an icon to open the first page in that section. For Dashboard, this opens your first dashboard. In the full view, click a section to expand or collapse it.
Dashboard
The Dashboard section lists your dashboards in their saved order. Click a name to open it. The current dashboard is highlighted in orange. Hover over a row to display its controls:
- Add dashboard: Click the + next to the section title to create a dashboard named New Dashboard. If that name already exists, CORE I/O adds a number, such as New Dashboard (2). The name opens for editing immediately.
- Rename dashboard: Click the pencil to edit the name. Press Enter or click elsewhere to save. Press Escape to cancel. An empty or unchanged name is ignored.
- Reorder dashboard: Drag the grip to move the dashboard. CORE I/O saves the order for your account.
To duplicate or delete a dashboard, open the Dashboards page in your profile. See Profile and Dashboard Management.
Configuration, Permissions, and System
These sections are available to administrators only.
Configuration contains Flows, Actions, Metadata Views, Encoder Presets, Export Presets, Stream Endpoints, File Browser, Integrations, Global, and Defaults. The RECORD group contains Naming Presets, Capture Presets, and Destination Presets. Permissions contains Users and Groups. System contains License and Logging. Each entry has a separate chapter in this manual.
Version display
The bottom of the sidebar displays two version numbers: UI identifies the web application, and COREI/O identifies the connected server. The narrow sidebar displays the numbers without labels. Include both versions when you report a problem.
Home button
Click the CORE I/O logo next to the menu button to open the dashboard you used most recently. On profile pages, a Back button replaces the menu button and performs the same action.
Page buttons
The buttons on the right side of the app bar depend on the current page.
| Button | Where | What it does |
|---|---|---|
| Enter Fullscreen / Exit Fullscreen (the arrows icon) | Dashboards | Enters browser fullscreen mode and hides the app bar and sidebar so that the dashboard fills the screen. You can also leave fullscreen mode with the browser shortcut, usually F11 or Esc. |
| Add Widgets | Dashboards | Opens the widget picker. You can also press A when no dashboard item has keyboard focus. See Dashboards and Widgets. |
| Add Flows | Flows page | Opens the dialog for adding a host and its first flow. See Flows. |
| ? (Open the user manual for this page) | Every page except the manual | Opens this manual at the chapter for the current page. On a dashboard, it opens Dashboards and Widgets. The ? button in a widget header opens the chapter for that widget. |
Health
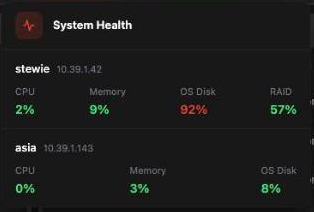
The Health button summarizes the status of every host that runs one of your flows. Its color represents the most severe state:
| Color | Meaning |
|---|---|
| Green | Every measured value is below 80%, and every Media Engine is connected. |
| Orange (pulsing dot) | At least one value is 80% or higher, or a Matrox M264 codec card reports 75°C or higher. |
| Red (pulsing dot) | At least one value is 90% or higher, a codec card reports 80°C or higher or a fan or temperature problem, or a Media Engine is disconnected. |
Click Health to open the System Health pop-up. It identifies each host by name and IP address and displays CPU, Memory, OS Disk, and RAID usage as percentages. If the host has a GPU, it also displays GPU Enc and GPU Dec. Each value uses the thresholds shown above. A host with an unavailable engine displays Media Engine Disconnected in red. Loading... appears until a host reports its status. No hosts connected appears when no flows are available.
The values update in real time while the pop-up is open.
Errors
The error button reads No Errors in green. If a visible flow has an unacknowledged error, it changes to Error in red with a pulsing dot. The button updates as soon as a flow reports an error.
Click Error to open the pop-up. The header displays the number of active errors as N Active Errors. Each entry shows the flow name, time, and error text; the list contains up to ten entries. To acknowledge one error, hover over it and click Dismiss. Click Dismiss All in the header to acknowledge every listed error. View Error History opens the All Errors page. If the button reads No Errors, click it to display the same View Error History link without an error list.
Dismissing an error removes it from the pop-up and from the error indicator in the corresponding flow widget.
The All Errors page
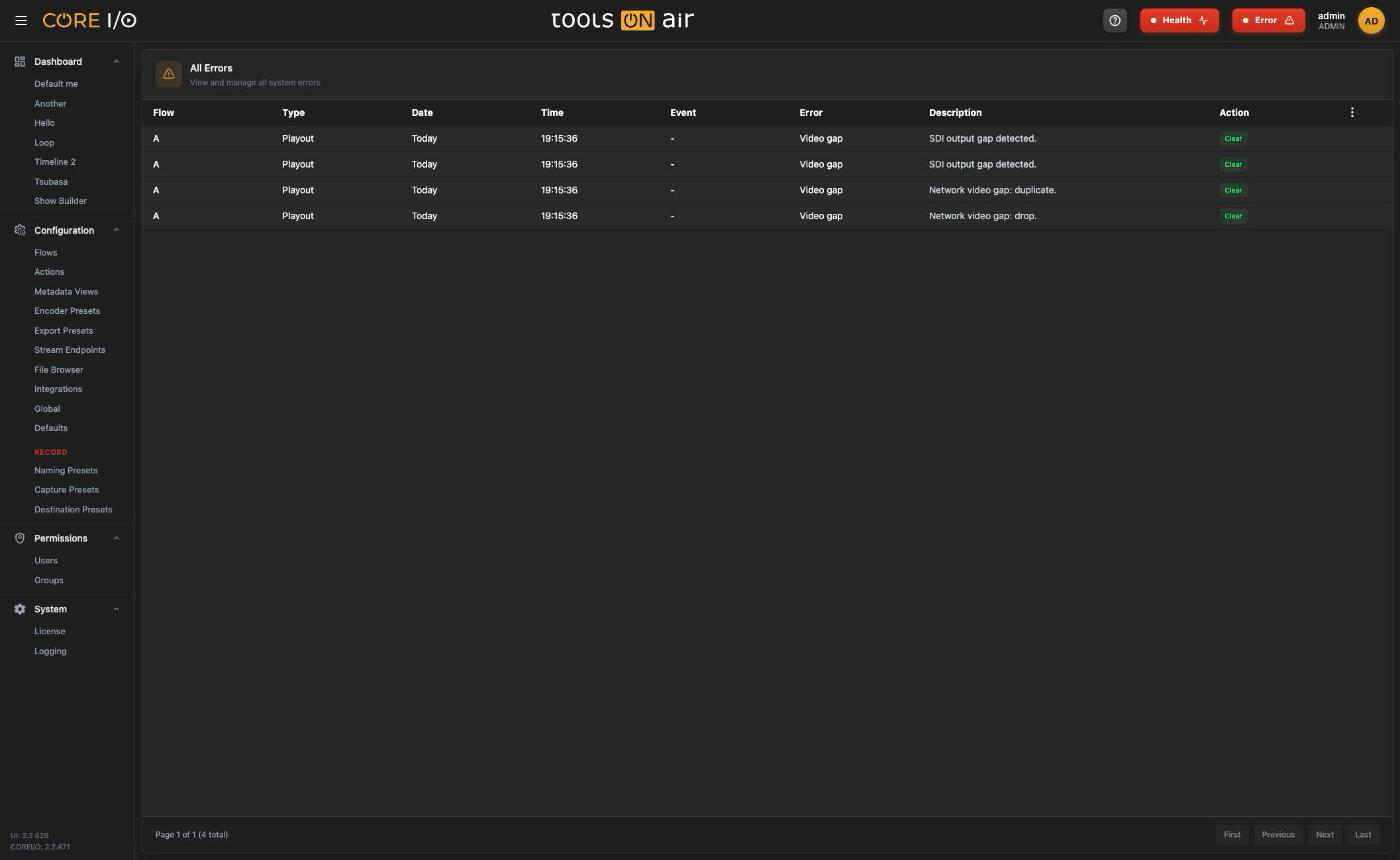
The All Errors page displays every error stored by the server, with 50 entries per page. The table contains Flow, Type, Date, Time, Event, Error, and Description. Type is the flow type. Event identifies the Record Timeline event that was running, or displays -. Error contains the short message, and Description contains the detailed message.
Click Flow, Type, Date, Time, or Error to sort the table. Click the same heading again to reverse the order. Click Clear in the Action column to delete an entry. Use First, Previous, Next, and Last to navigate through the list. The footer displays the current position, for example Page 1 of 3 (120 total).
The three-dot menu at the right side of the header contains two commands:
- Clear All: Deletes every error and returns to the dashboard.
- PDF Export: Exports the current page in its current sort order as
TOA_coreIO_<date>_<time>_errors.pdf. The PDF contains the Flow, Type, Date, Time, Event, Error, and Description columns.
The All Errors page
Errors inside a widget
A widget assigned to a flow has its own error icon. Click it to open Errors and Warnings, which lists the flow errors with Date, Time, Type, and Description. Click CLEAR to acknowledge all errors or CANCEL to close the dialog. Shift-click the icon to clear the errors without opening the dialog. Press Shift+W to clear errors in the selected widget.
User menu
The right side of the app bar displays your name and role next to your avatar. An AD badge identifies an Active Directory account. Click the avatar to open the menu:
| Entry | What it does |
|---|---|
| Edit Profile | Opens your profile page. See Profile and Dashboard Management. |
| Lock Dashboard | Closes the menu. Locking is done per widget with the lock icon in each widget's header. |
| User Manual | Opens this manual at the chapter for the current page. |
| Developer Docs | Closes the menu. |
| REST API | Opens the server's interactive API documentation in a new tab. |
| Logout | Ends your session and returns to the sign-in page. |
Popups and clicks
Only one app bar pop-up can be open at a time. Opening another one closes the first. Clicking outside a pop-up closes it, but that click does not affect the page below. It does not select a dashboard widget or change the selection on the Flows canvas. When no pop-up is open, clicks affect the page as usual.
Notifications
Short notifications appear in a corner of the window. They confirm actions such as License activated., report warnings such as Activation failed., and announce events such as Media Engine connection lost for. Notifications close automatically. Shift-click a notification's close button to dismiss all notifications at once.
Impersonation bar
Administrators can impersonate another user from the Users page to view CORE I/O with that user's access and settings.
During impersonation, a red bar above the app bar displays You are impersonating: followed by the user name. Every action is performed as that user. Click Get out to return to your own account. The button reads Ending... while CORE I/O switches accounts, then the Users page reloads. The impersonation bar is hidden in fullscreen mode.