
Use the Logging page to change backend log levels while the server is running. Increase a component's detail when requested by support, or reduce the level for a noisy component. Open Logging in the System section of the sidebar. This page is available only to administrators.
The header reads "Logging Configuration: Configure log levels for application components" and shows the number of visible loggers, for example "12 of 40 loggers" when a filter is active.
The Logging page
Layout
A filter bar sits above a table with three columns:
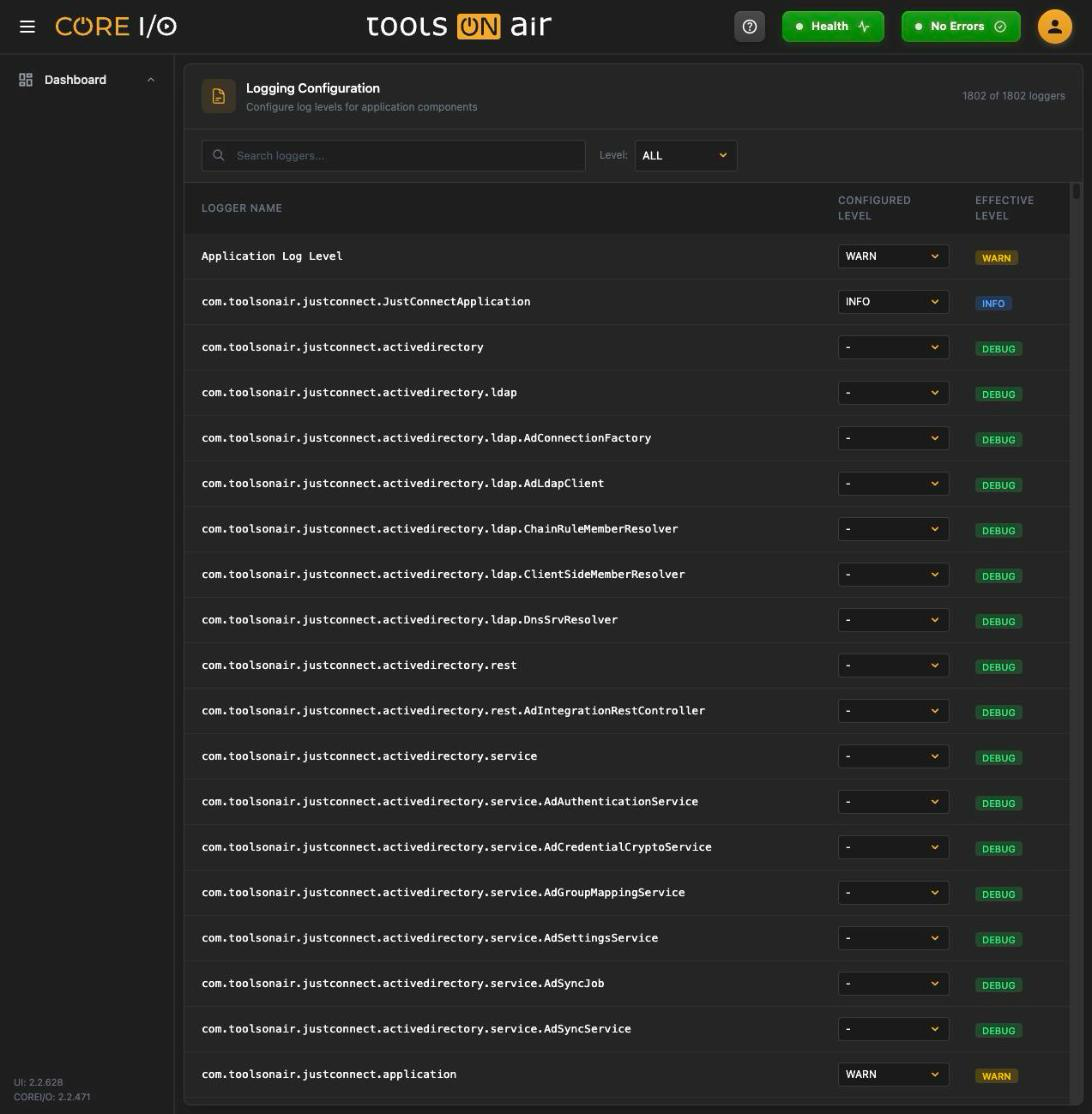
| Column | Content |
|---|---|
| Logger Name | The component's name. The root logger is shown as Application Log Level; it is the fallback for every component without its own setting. |
| Configured Level | A select with the level set explicitly for this logger. - means none is set and the logger inherits. |
| Effective Level | The level currently in force, shown as a colored badge: ERROR red, WARN yellow, INFO blue, DEBUG green, TRACE purple, and other levels gray. |
The levels available in the selects are the ones the backend reports.
Changing a level
- Find a logger with Search loggers..., which matches the displayed name, or use the Level filter to show loggers with a specific effective level. Select ALL to show every logger.
- Select a Configured Level. The change applies immediately; there is no Save button.
- Select - to remove the explicit setting. The logger then inherits its effective level from its parent.
When the search and filter match nothing, the table shows "No loggers found" with "Try adjusting your search or filter criteria".
Good to know
Levels set here take effect at once on the running backend; there is nothing to save or restart.
DEBUG and TRACE on Application Log Level produce a lot of output. Prefer raising the level of the one component you are interested in.
A change that the backend refuses is not applied; the select keeps its previous value.